
What Your VMware Monitoring Data Is Actually Telling You: Time to Migrate
Executive Summary
- VMware monitoring data increasingly reflects accumulated platform strain rather than isolated performance issues, even when availability remains high.
- Repeating signals across capacity, change flow, and recovery patterns indicate structural limits forming inside the virtualization stack.
- Operational metrics show that stability depends more on manual coordination and experience than on system behavior.
- At that stage, monitoring shifts from guiding optimization to defining strategic constraints and timing.
- Migration decisions become evidence-driven responses to repeated signals, not reactions to isolated incidents.
***
NOVA helps you interpret these signals clearly and plan a controlled AWS migration grounded in your actual data. Contact NOVA to discuss your next steps.
Do your dashboards no longer surprise you? Capacity warnings recur, recovery stretches out, and the same engineers carry stability on their backs. Over time, VMware performance monitoring stops acting like tuning feedback and starts behaving like a record of accumulated strain.
Across mid-sized SaaS teams, this pattern shows up the same way: more alerts, longer incident tails, and growing hesitation around releases. Individually, these feel manageable, but together, they form a pattern your dashboards are already recording.
In this article, you learn how to interpret those signals, and see when performance metrics justify an exit conversation.
Keep reading below.
What Is VMware Monitoring?
VMware monitoring is the practice of collecting and analyzing performance, capacity, and availability data across your VMware environments.
In practice, it spans compute through VMware vSphere, storage via vSAN, networking through NSX, and the behavior of virtual machines and clusters that make up your virtual infrastructure. That visibility exists to help you keep systems stable as demand changes.
And it does that well. Given how central virtualization still is for many organizations, this matters. According to Forrester study, across 1 virtualization capabilities, at least 75% of organizations have already planned or implemented multiple virtualization and infrastructure capabilities. This means monitoring data now sits at the center of most operational decisions.
What VMWare Monitoring Is Meant to Answer
VMWare monitoring helps you confirm whether workloads behave as expected. It shows whether resources remain balanced under load and whether users experience degradation.
Monitoring tools track CPU utilization, memory usage, and storage I/O control patterns to isolate pressure points. As a result, incidents become easier to detect and resolve within existing constraints.
What VMWare Was Not Designed to Answer
However, monitoring was never meant to judge platform viability. It does not tell you whether licensing terms still make sense, how exposed you are to renewal risk, or when repeated resource utilization tradeoffs stop being operational choices.

Pro tip: Are recurring alerts starting to feel like accepted risk rather than exceptions? If so, check out our guide on VMware support risks cloud-first teams keep running into.
VMware Monitoring Basics (What Most Teams Measure)
You already spend time reviewing the same dashboards before incidents escalate or capacity becomes a blocker. Patterns repeat, thresholds tighten, and decisions get made long before strategy enters the room. In that context, the measurements that tend to shape daily judgment fall into a few familiar areas.
Infrastructure-Level Visibility
At the infrastructure layer, monitoring focuses on how the underlying platform absorbs load and distributes pressure. In practice, these are the signals you review first when something feels off:
- Host CPU and memory utilization: At this level, CPU and memory trends show how well compute capacity keeps up with demand. Sustained pressure here typically points to tightening resource allocation, even when workloads appear stable.
- VM resource consumption: VM-level views help isolate which workloads consume shared capacity and how evenly resources spread across clusters. In time, this data exposes patterns that tuning alone cannot flatten.
- Disk latency and IOPS: Storage metrics reveal whether the system can sustain predictable peaks. In most environments, disk performance is considered healthy when read latency stays under 5 ms and write latency under 10 ms, while sustained ranges above 20-30 ms raise warning or critical flags. At that point, delays reflect platform limits rather than misconfigured workloads.
- Network throughput and packet loss: Network data shows whether east-west traffic flows cleanly or stalls under load. As network latency rises, application behavior degrades in ways that tuning rarely resolves.
Operational Basics
Beyond raw infrastructure data, monitoring also supports day-to-day operations. These signals shape how teams respond under pressure:
- Alert thresholds and health checks: Alerts surface deviations from expected behavior. With time, frequent alerts can reveal recurring conditions rather than isolated events.
- Capacity trend reporting: Trend views project future demand based on historical patterns. As capacity buffers shrink, forecasts begin driving procurement and prioritization discussions.
- Incident correlation: Correlation links symptoms across systems. When recovery depends on manual sequencing, CPU performance and network signals usually converge around the same failure paths.
When taken together, these measurements describe a virtual environment that survives through constant attention.
Why Monitoring Signals Mean Something Different in 2026
Before Broadcom's acquisition closed in November 2023, monitoring data guided optimization within a stable vendor relationship. Now that context has changed.
Partner program consolidation eliminated thousands of authorized providers. Pricing increases of 300-1,500% have hit customers across the industry. And the October 2025 deadline for VCSP transitions removed the flexibility many organizations relied on.
In this environment, monitoring signals that once prompted hardware upgrades now prompt harder questions. When the cost of staying exceeds the cost of leaving, capacity alerts become exit indicators rather than procurement triggers.
VMware Monitoring Metrics That Indicate Platform Strain (Not Just Performance Issues)
In time, certain patterns may start repeating across dashboards even when teams respond quickly, and systems stay available. In that context, the signals that matter most tend to fall into a few technical areas that quietly point to strain at the platform level.
So, let's talk about them quickly.
Compute & Memory Pressure
At the compute layer, persistent CPU overcommitment becomes more and more frequent. Peaks no longer align with short-lived events, and headroom disappears faster after each adjustment.
Alongside that, memory ballooning and swapping show up more frequently, even after tuning efforts. As a result, the environment compensates by shifting pressure instead of removing it.
These performance statistics rarely indicate misconfiguration at this stage. Instead, they reflect static infrastructure absorbing demand that keeps changing. In the long run, that tradeoff increases resource constraints and makes stability depend on careful timing and experienced operators.
Storage & I/O Constraints
Storage metrics follow a similar pattern. Rising vSAN latency appears during predictable peaks and not just unexpected surges. Also, disk contention becomes part of normal operation, especially during backups, patch windows, or reporting cycles.
At first, incremental fixes reduce the impact. But as capacity fills, each addition delivers less relief than before.
In practice, storage performance metrics stop pointing to isolated issues and start describing diminishing returns from CapEx-heavy scaling. That shift shows you the system remains functional while the cost and effort required to keep it that way steadily increase.
Network & Dependency Complexity
Network signals add another layer. East-west traffic grows as services rely more on internal calls, and saturation shows up long before external links fill. At the same time, NSX rule sets expand to manage segmentation, exceptions, and edge cases. What begins as necessary control gradually turns into operational weight.
As network traffic patterns tighten, small changes carry wider impact, and troubleshooting paths lengthen. In effect, the environment accumulates performance bottlenecks that are hard to attribute to a single change. When taken together, these metrics describe a platform that still runs but demands increasing coordination to do so.
If you see these in isolation, each signal looks manageable. But when you read them together, they describe a system working harder to stay the same.
Operational VMware Metrics That Reveal Migration Readiness
After a while, the strain starts surfacing in how work actually gets done. In that context, the operational signals that matter most tend to cluster around change flow, recovery behavior, and how safely the environment can still evolve.
These are the patterns you see most clearly in how changes move, how incidents recover, and how safely the environment can still evolve.
Change Velocity Indicators
Change no longer feels lightweight, even when the scope stays small. Lead times stretch because every update requires coordination across teams, maintenance windows, and rollback planning. With time, the blast radius of minor changes grows, which slows decision-making before code ever moves.
In that context, elite performance looks increasingly distant.
One commonly used proxy for change friction is lead time for changes: how long it takes for code to move from commit to production. According to the 2025 DORA report, only 9.4% of teams achieve a lead time for changes under one hour.
That matters not because it describes VMware environments specifically, but because it shows how rare low-friction change has become even in modern delivery setups. When change is already this constrained at the industry level, any additional platform drag compounds the problem.
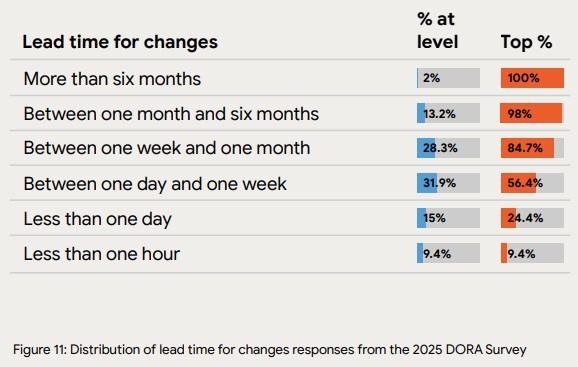
Source: DORA 2025 report
As a result, the platform begins limiting agility, and effort shifts from delivery to cautious resource reallocation just to keep risk contained.
Pro tip: Is slow change a tooling problem or a platform limit? See how teams rethink delivery using DevOps-driven cloud operating models.
Incident Recovery Patterns
Recovery behavior reinforces the same story. Alerts multiply, dashboards improve, and coverage expands. Yet MTTR trends upward because resolution depends less on automated paths and more on experience and judgment.
In many environments, incident response relies on the same people knowing where to look and what sequence to follow. That dependency shows up clearly in industry data. The DORA 2025 report indicates that only 21.3% of teams recover from incidents in under one hour. That statistic lands differently when manual intervention becomes routine.
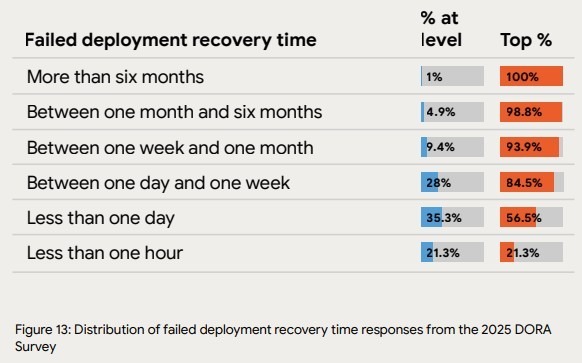
Source: DORA 2025 report
At that point, stability rests on people compensating for limits in the virtualization layer, rather than systems correcting themselves. With time, recurring incidents obscure the root causes instead of removing them.
Lifecycle Friction
Lifecycle signals complete the picture. Upgrades get deferred because the risk feels asymmetric. And patching waits for quieter periods that never arrive.
Each delay feels reasonable on its own, but together they signal preservation instead of the progress you need. As dependencies deepen, even routine maintenance threatens availability and the end-user experience. In effect, the environment stays alive by avoiding change rather than supporting it.
If your monitoring data keeps pointing to the same constraints, it may be time to reassess the platform itself. Contact NOVA today and plan next steps with clarity.
Why VMware Monitoring Can’t Solve These Problems
VMware monitoring can’t solve these problems because it was built to observe and diagnose behavior inside the platform rather than to change the structural forces shaping it. As outlined earlier, monitoring answers whether systems behave as expected, but it stays silent on economic exposure and long-term viability.
In that context, the limits become clearer when viewed through two recurring patterns. So, these are the ways monitoring exposes constraints without removing them, and how teams get pulled into a cycle of repeated optimization.
Monitoring Exposes Limits, But It Doesn’t Remove Them
At its best, monitoring gives clear visibility. Dashboards in VMware vCenter Server show where pressure accumulates and which paths fail first. However, that clarity stops short of control.
Dashboards do not alter licensing terms, and performance alerts do not create elasticity where none exists. Visibility also does not reduce renewal risk or soften contract-driven timelines. As a result, the data stays accurate while the decisions around it become harder.
In the long run, this gap forces teams to manage capacity shortages through careful timing and manual coordination rather than structural change. The platform remains observable, but its limits stay intact.
The False Optimization Loop
When those limits persist, a familiar loop takes hold. Thresholds get tuned to reduce noise. New tooling gets added to improve correlation. And hardware gets extended to buy time.
Then the cycle repeats. Each step feels justified, especially when availability holds, and incidents remain contained. Yet each pass delivers less relief than the one before. In practice, extending hardware components excessively shifts pressure without removing it, and added tooling increases operational surface area.
That’s why we at NOVA only view extending hardware as a controlled bridge strategy.
Make sure that optimization doesn’t become a way to delay decisions rather than resolve constraints. That matters because the data itself begins to change its message. Instead of pointing to the next fix, it starts describing a system that survives by effort alone.
At that stage, monitoring still works as designed. What changes is what it tells you. The signal moves from “tune further” to “reconsider the platform,” and that transition sets the conditions for an exit conversation rather than another round of adjustment.
When Your VMware Monitoring Data Should Trigger an AWS Migration Conversation
Your VMware monitoring data should trigger an AWS migration conversation when recurring signals stop informing tuning decisions and start dictating strategic constraints.
At that point, the data no longer helps you stabilize the platform. Instead, it limits the choices available to you. In that context, the moments that matter most tend to surface through a few clear scenarios tied to capacity, effort, cost, and timing.
These are the scenarios where that shift becomes hard to ignore.
Trigger 1: Capacity Alerts Tied to Hardware Procurement
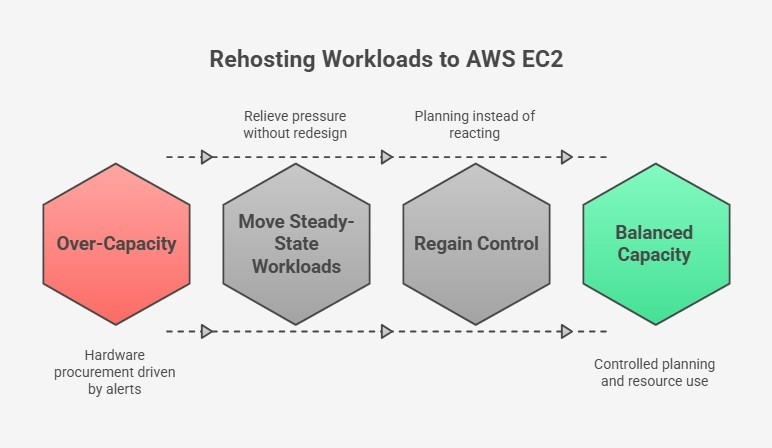
Capacity alerts become a forcing function when they align directly with procurement cycles. As headroom tightens, alerts stop prompting short-term adjustments and begin driving hardware requests.
At that stage, every increase in demand pulls forward capital spend and extends dependency on fixed infrastructure. This is where rehosting suitable workloads to AWS EC2 becomes a rational response.
Moving steady-state workloads off the platform relieves pressure without redesigning the entire environment. This creates breathing room to plan a structured exit instead of reacting to alerts.
Trigger 2: Stable Workloads with High Operational Overhead
Some workloads remain stable from a performance standpoint while still consuming disproportionate operational effort. These services rarely page teams, yet they require frequent coordination, patching windows, and manual oversight. That overhead compounds over a longer period.
In that context, industry research shows that adopting cloud infrastructure can reduce compute, storage, and networking costs by up to 66% compared to traditional on-premises systems.
That reduction reflects fewer moving parts to manage. Moving these workloads to AWS-native services like ECS, EKS, or Fargate reduces the amount of infrastructure that needs to be actively managed and gives you service ownership back.
Pro tip: Are steady workloads still consuming too much effort? Explore how teams simplify operations with AWS-native analytics and services.
Trigger 3: Cost Pressure with No Optimization Levers Left
Cost pressure increases when optimization stops producing meaningful gains. After repeated right-sizing, scheduling, and consolidation, spend still rises because the platform itself enforces overprovisioning.
Industry cloud adoption research indicates that over 80% of on-premises workloads are overprovisioned, with only about 16% sized appropriately for actual demand. That imbalance explains why cost discussions stall.
Replacing VMware constructs with AWS-native services removes the need to plan for peak capacity everywhere. This turns cost control into a system behavior instead of a constant negotiation.
Trigger 4: Renewal Timelines Driving Architecture Decisions
The final trigger appears when renewal dates begin shaping technical decisions. Architecture choices get delayed or accelerated to align with contracts rather than risk.
At that point, short-term stability matters, but long-term flexibility matters more. Stabilizing the environment while planning a structured exit allows you to decouple platform decisions from renewal pressure and move on your own timeline.
Pro tip: Are contract timelines dictating architecture choices? Check out our guide to understand how others regain leverage with smarter licensing and migration planning.
What AWS Migration Looks Like Without VMware
AWS migration without VMware means moving workloads to AWS without carrying the VMware stack forward. That shift removes dependency on vSphere, vSAN, NSX, and vCenter, along with the VMware hypervisor and Broadcom contract constraints.
Because of that, platform decisions stop being shaped by renewal timing and start reflecting operational intent. This approach separates short-term stability from long-term direction and gives you room to act deliberately.
What Does AWS-Native Mean?
AWS-native means running workloads directly on AWS services without a VMware hypervisor layer in between. That design choice eliminates the need to operate VMware control planes, align upgrades across stacks, or account for vendor-driven lifecycle constraints.
More importantly, it changes how responsibility is distributed.
Capacity, scaling, and availability become properties of the platform rather than outcomes of constant coordination. That reduces the effort required to keep application performance predictable as demand shifts.
Commonly Used AWS Services
Once the VMware layer is removed, the building blocks change. At that point, the services that tend to come into focus reflect how workloads actually behave today. These are the components most teams rely on to regain control over execution:
- EC2 for rehost workloads: For steady workloads that do not need redesign, EC2 provides a clean landing zone. This preserves runtime behavior while removing infrastructure coupling.
- RDS and Aurora for database modernization: Managed databases replace self-operated clusters, which reduces operational risk and removes patching dependencies.
- ECS, EKS, and Fargate for containers: Container platforms shift responsibility for orchestration and scaling to AWS, which limits manual intervention during change.
- Lambda for event-driven compute: Event-driven functions handle bursty or asynchronous tasks without reserving idle capacity.
- S3, CloudFront, DynamoDB, and API Gateway: These services replace custom-built components and offload durability, distribution, and scaling concerns.
Together, these services change the shape of operations. Instead of managing infrastructure state, attention moves toward service behavior and failure boundaries.
Benefits of AWS Migration Without VMware
As this model takes hold, a different set of outcomes emerges. So, these are the benefits teams tend to notice first as operational patterns settle:
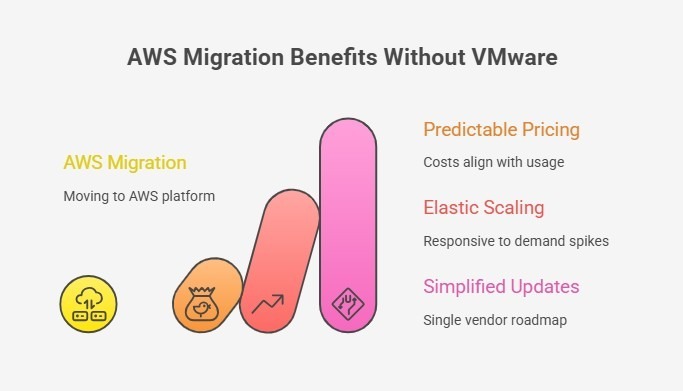
- Predictable pricing: Costs align more closely with actual network usage and demand instead of being driven by peak capacity that must be provisioned upfront.
- Elastic scaling: Scaling becomes responsive, which reduces pressure during demand spikes and release cycles.
- Unified AWS-native lifecycle: Platform updates follow AWS-native service paths. This simplifies planning and removes dependency on external vendor licensing cycles.
Where NOVA Differs from Traditional VMware Consultants
Most VMware consultants optimize within the platform. NOVA helps you exit it entirely.
Our VMware Freedom Initiative combines three capabilities designed for controlled departures:
- Bridge support: 24x7x365 managed VMware operations using your existing perpetual licenses, buying time without renewing Broadcom contracts.
- Asset relief: Hardware buy-out and lease-back programs that convert trapped capital into migration funding.
- AWS migration expertise: Leveraging AWS funding programs (up to $2 million through MAP and VMware-specific accelerators) to offset transition costs.
This matters because monitoring data alone cannot answer the strategic question. The question is whether your organization treats these signals as optimization inputs or exit indicators.
How NOVA Uses VMware Monitoring Insights to Guide AWS Migration
At NOVA, we approach migration as a consequence of what your monitoring data already shows. From our perspective, those signals matter because they reveal where effort accumulates and where risk quietly increases.
In that context, the way forward tends to follow a clear sequence. So, these are the steps we use to move from observation to action without forcing premature decisions.
Step 1: VMware Environment Stabilization (Bridge Support)
First, we stabilize what already runs your business. Bridge Support provides temporary, managed VMware operations using your existing perpetual licenses. As a result, forced Broadcom renewals no longer dictate timing. Day-to-day risk stays contained, and operational pressure eases.
More importantly, this creates space to think. Instead of reacting to renewal deadlines or capacity alerts, decisions can reflect actual platform behavior and business priorities.
Stability here is not an endpoint. It is the condition that allows informed planning to begin.
Step 2: Monitoring-Informed Migration Planning
Once stability holds, we shift attention to interpretation. Monitoring data becomes input for planning rather than firefighting. Real utilization patterns guide how workloads map to AWS services, which avoids copying constraints into a new environment. From there, steady workloads remain steady, while candidates for modernization stand out clearly.
This approach reduces rushed, like-for-like moves and replaces them with deliberate choices aligned to how systems are actually used. Migration planning reflects reality rather than assumptions carried forward from legacy design.
Remember: In practice, these signals don’t come only from performance charts. They also emerge from cost structures, licensing models, and the operational friction teams absorb over time.
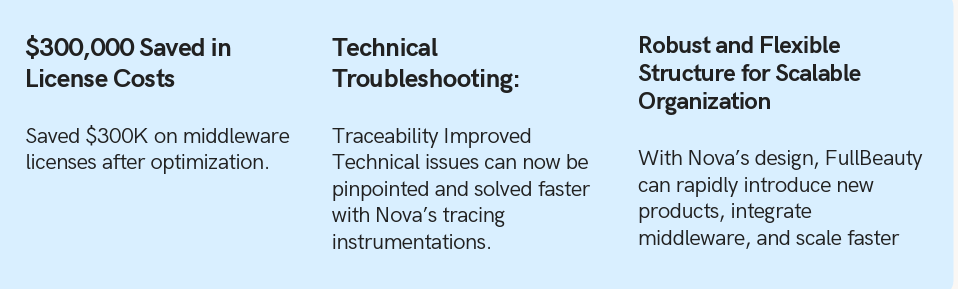
For example, with FullBeauty Brands, we identified a major cost and rigidity signal outside the virtualization layer: an overpriced middleware platform that cost $300K annually.
By replacing it with AWS serverless architecture at roughly $50K per year, we demonstrated how licensing pressure and operational friction can create migration opportunities across the enterprise stack, not just within VMware.
Step 3: Asset Relief to Fund Migration
Finally, we address the financial side that typically blocks your progress. Asset Relief is not about extending hardware to avoid change. It is about monetizing existing assets to make change possible.
Through hardware buy-out and lease-back, trapped capital becomes available without disrupting operations. That converts fixed investment into operating flexibility and funds the transition itself.
In effect, migration no longer competes with existing budgets. Instead, it becomes executable. The result is a clean exit path that aligns technical readiness with financial control.
Conclusion: Your VMware Monitoring Data Is Already Making the Case
Across repeated cycles, your dashboards have shifted from showing isolated issues to exposing repeating constraints. Capacity pressure, slower change, fragile recovery, and deferred maintenance now form a consistent pattern.
When taken together, those signals point less to tuning gaps and more to platform limits. That distinction matters because optimization can only delay decisions and not remove them.
At some point, stability depends on effort rather than structure, and risk accumulates quietly. In that moment, migration becomes a consequence of evidence, not ideology.
To assess those signals clearly and plan a controlled exit from VMware toward AWS-native infrastructure, contact NOVA to discuss your environment.
Comments